I’m a big proponent of debugging in VSCode. Given that I end up re-setting it up for myself for new projects and sharing my configs with other people, I wanted to centralize my code snippets.
I think more developers should consider debugging in VSCode (especially if they already edit their code in the app!). It’s been a massive boost to my productivity, and I’ve heard similar feedback from others that I’ve encouraged to use it.
Most of the pushback that I’ve heard in my evangalizing is that people think it’s difficult to set it up, but hopefully this post will show that it takes just a few minutes for each config.
Caveats
Launching processes through the debugger is slower than launching them normally. However, the amount of time I save in the rest of the development cycle by using the debugger more than makes up for this.
I don’t have a clean solution for environment variables (I’m lazy and enumerate all of them in the launch.json file), but I’m sure there are better ways to handle this (e.g., a .env file).
Setting up the VSCode debugger for Python
This post walks through setting up VSCode for debugging Python, and contains sample configurations for a launch.json file.
The hope is that these examples can be useful starting points to be adapted for different projects.
Configuring debugging via launch.json
Configuration
Before we can use the debugger, the Python and Python Debugger extensions must be installed for VSCode. Then, create a virtual environment and set it as the Python interpreter for the project:
- Create and open a new project:
mkdir sample_python; code sample_python - Create a virtual environment for the project:
python -m venv .venv - Set the Python interpreter for the project:
cmd + shift + p > Python: Select Interpreter, select.venv
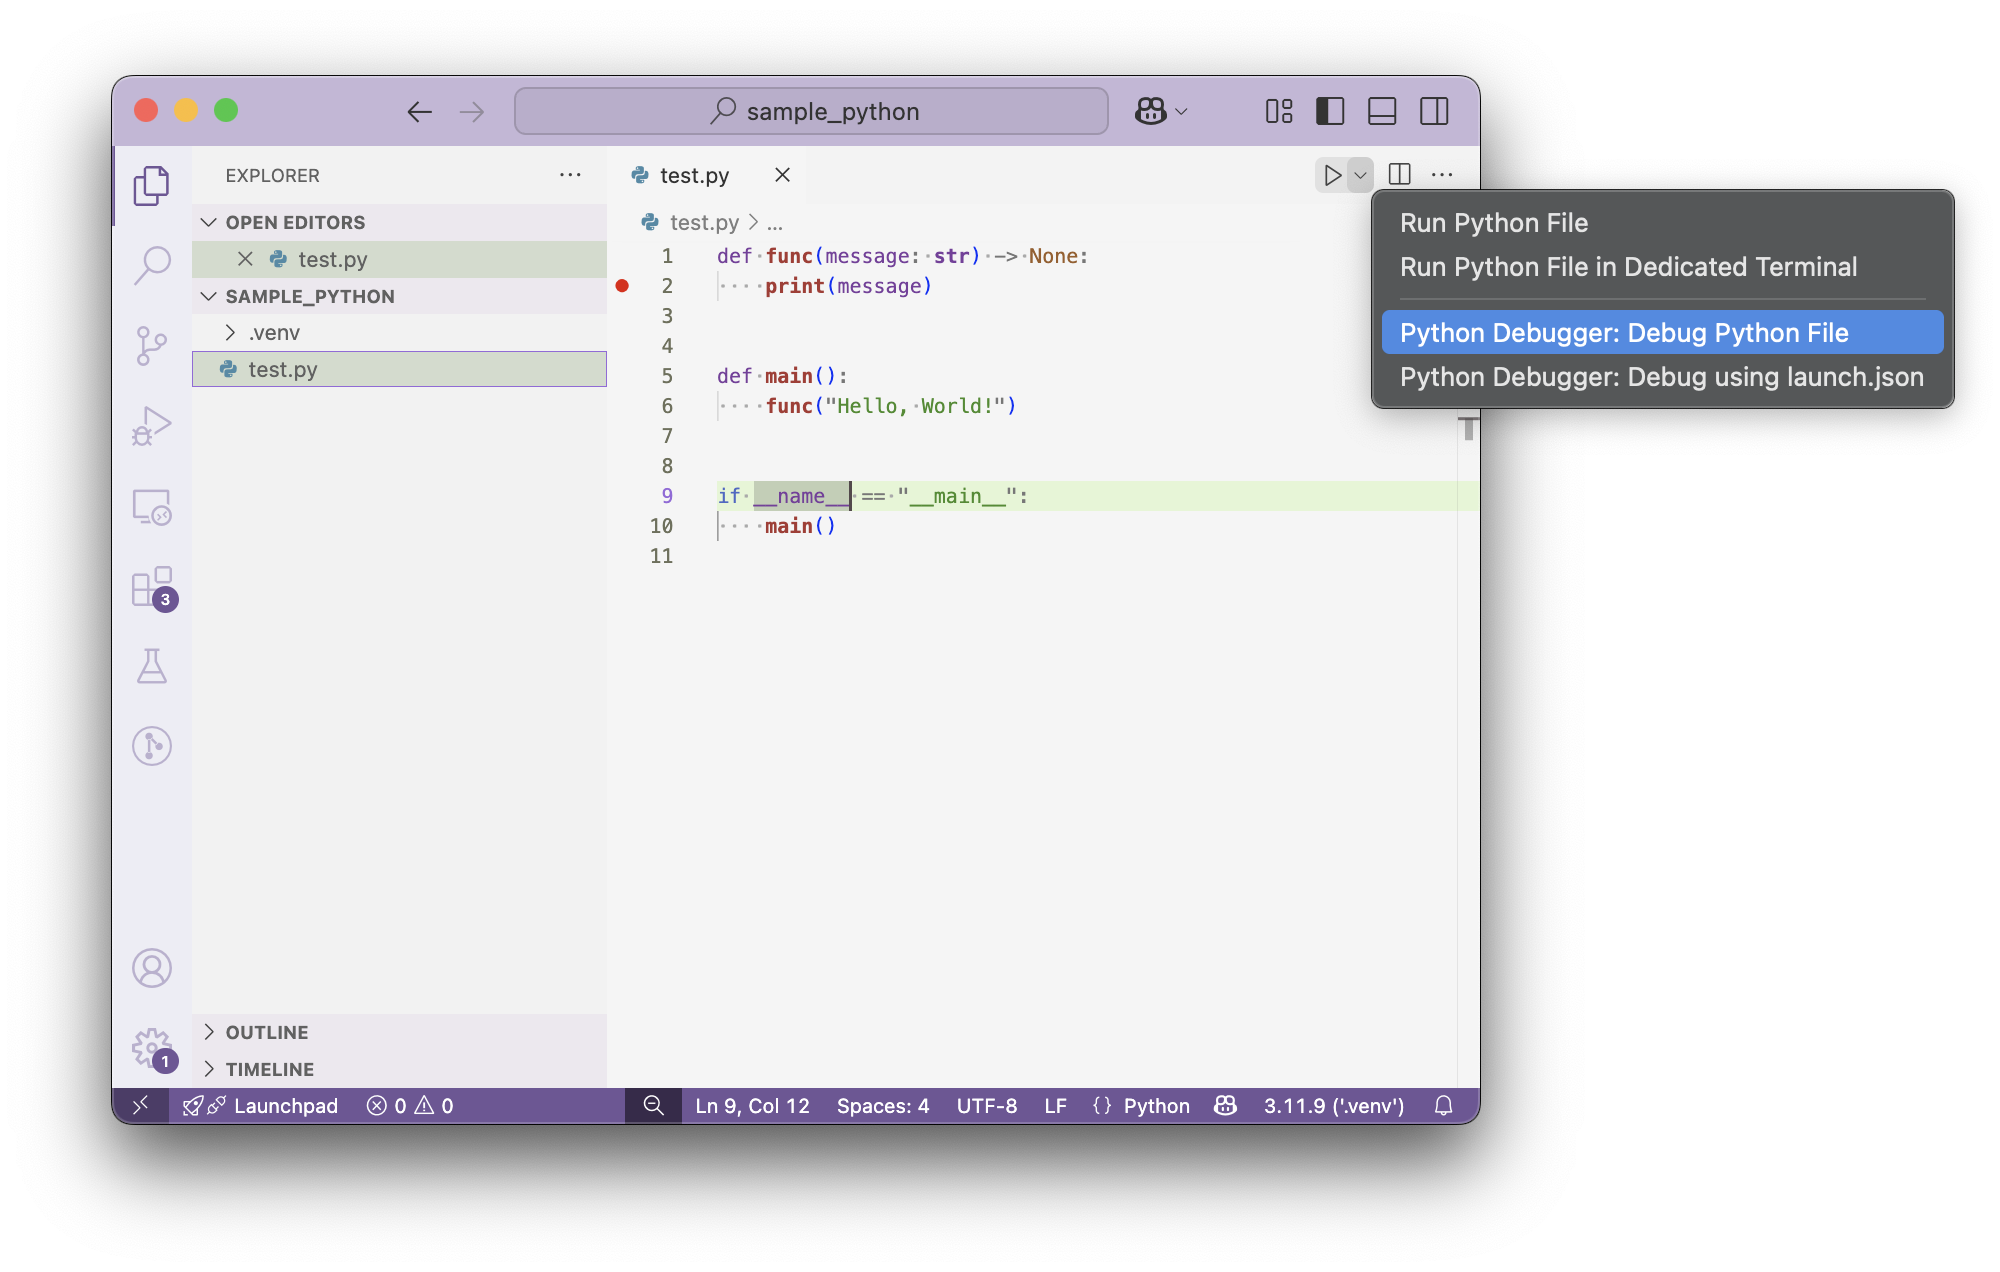
Debugging a standalone file
VSCode makes it easy to run and debug a file from the editor. This option works well when the code doesn’t depend on input arguments or environment variables, and when you don’t need to set breakpoints in dependencies.
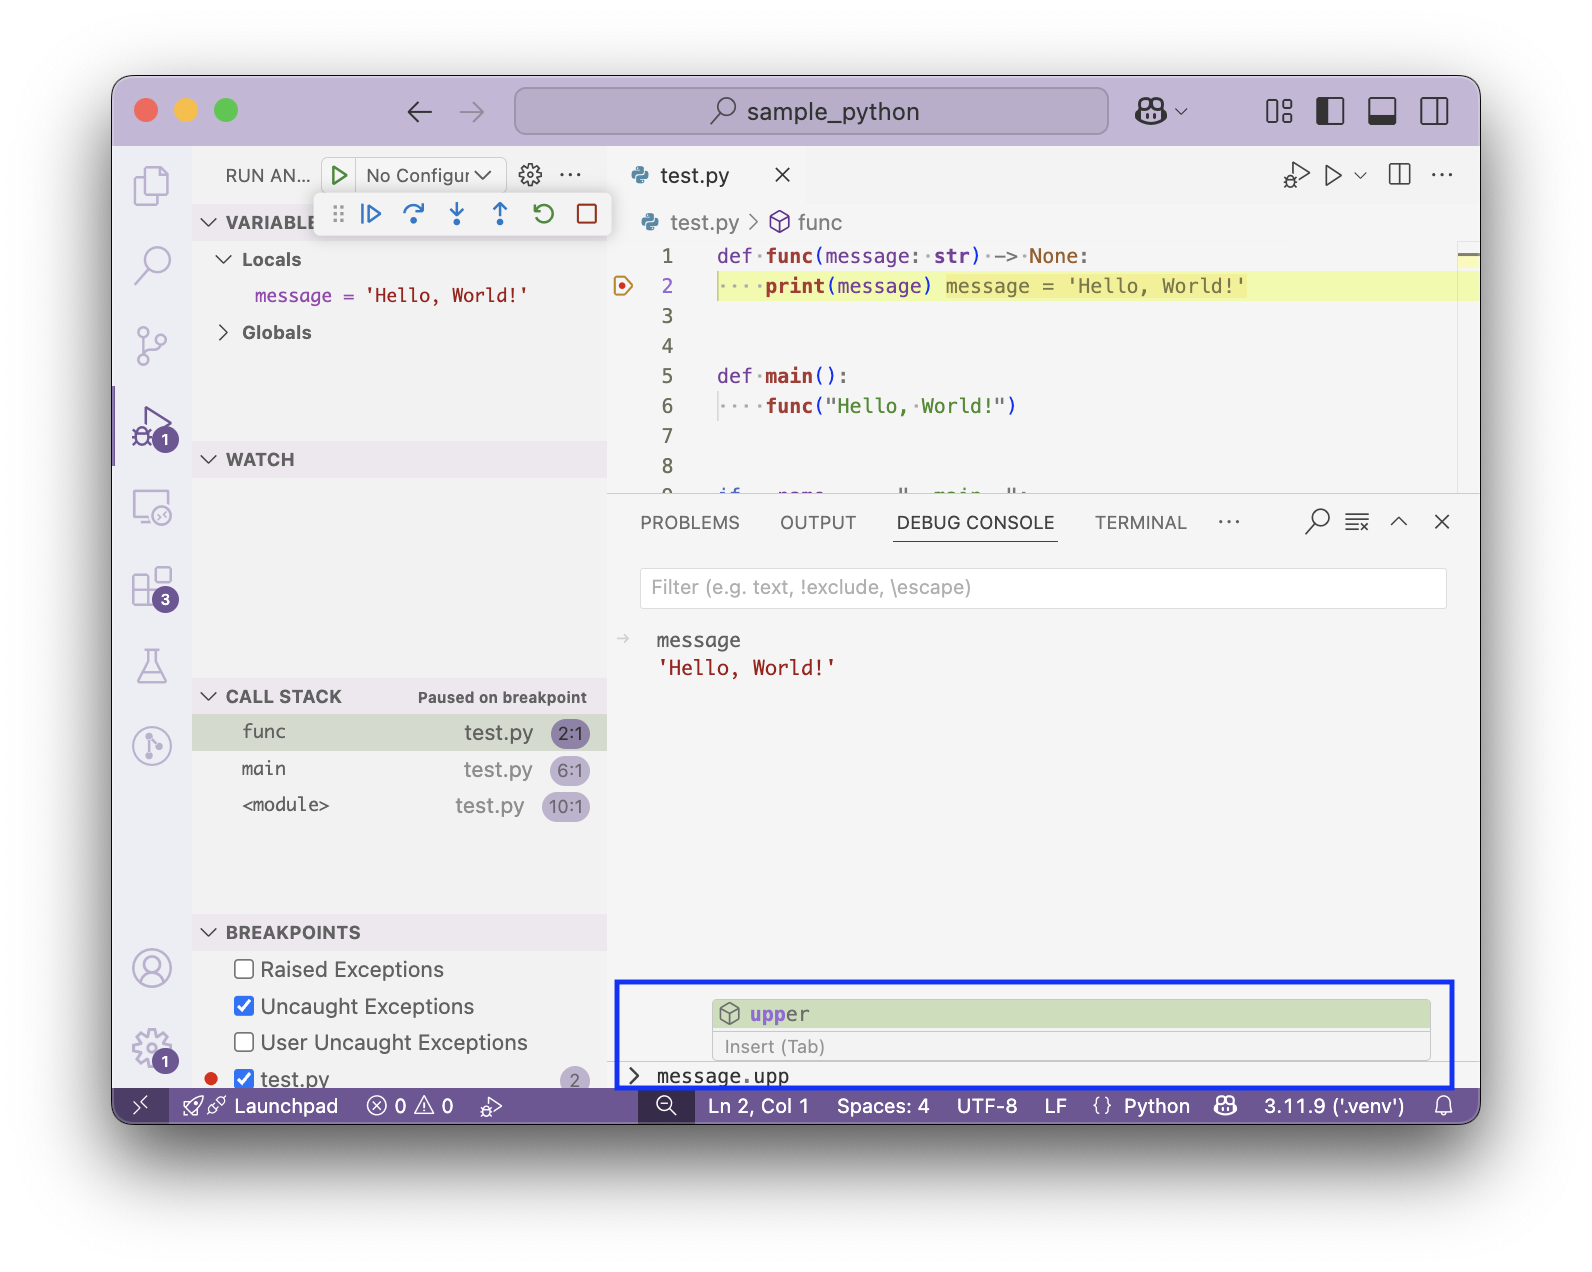
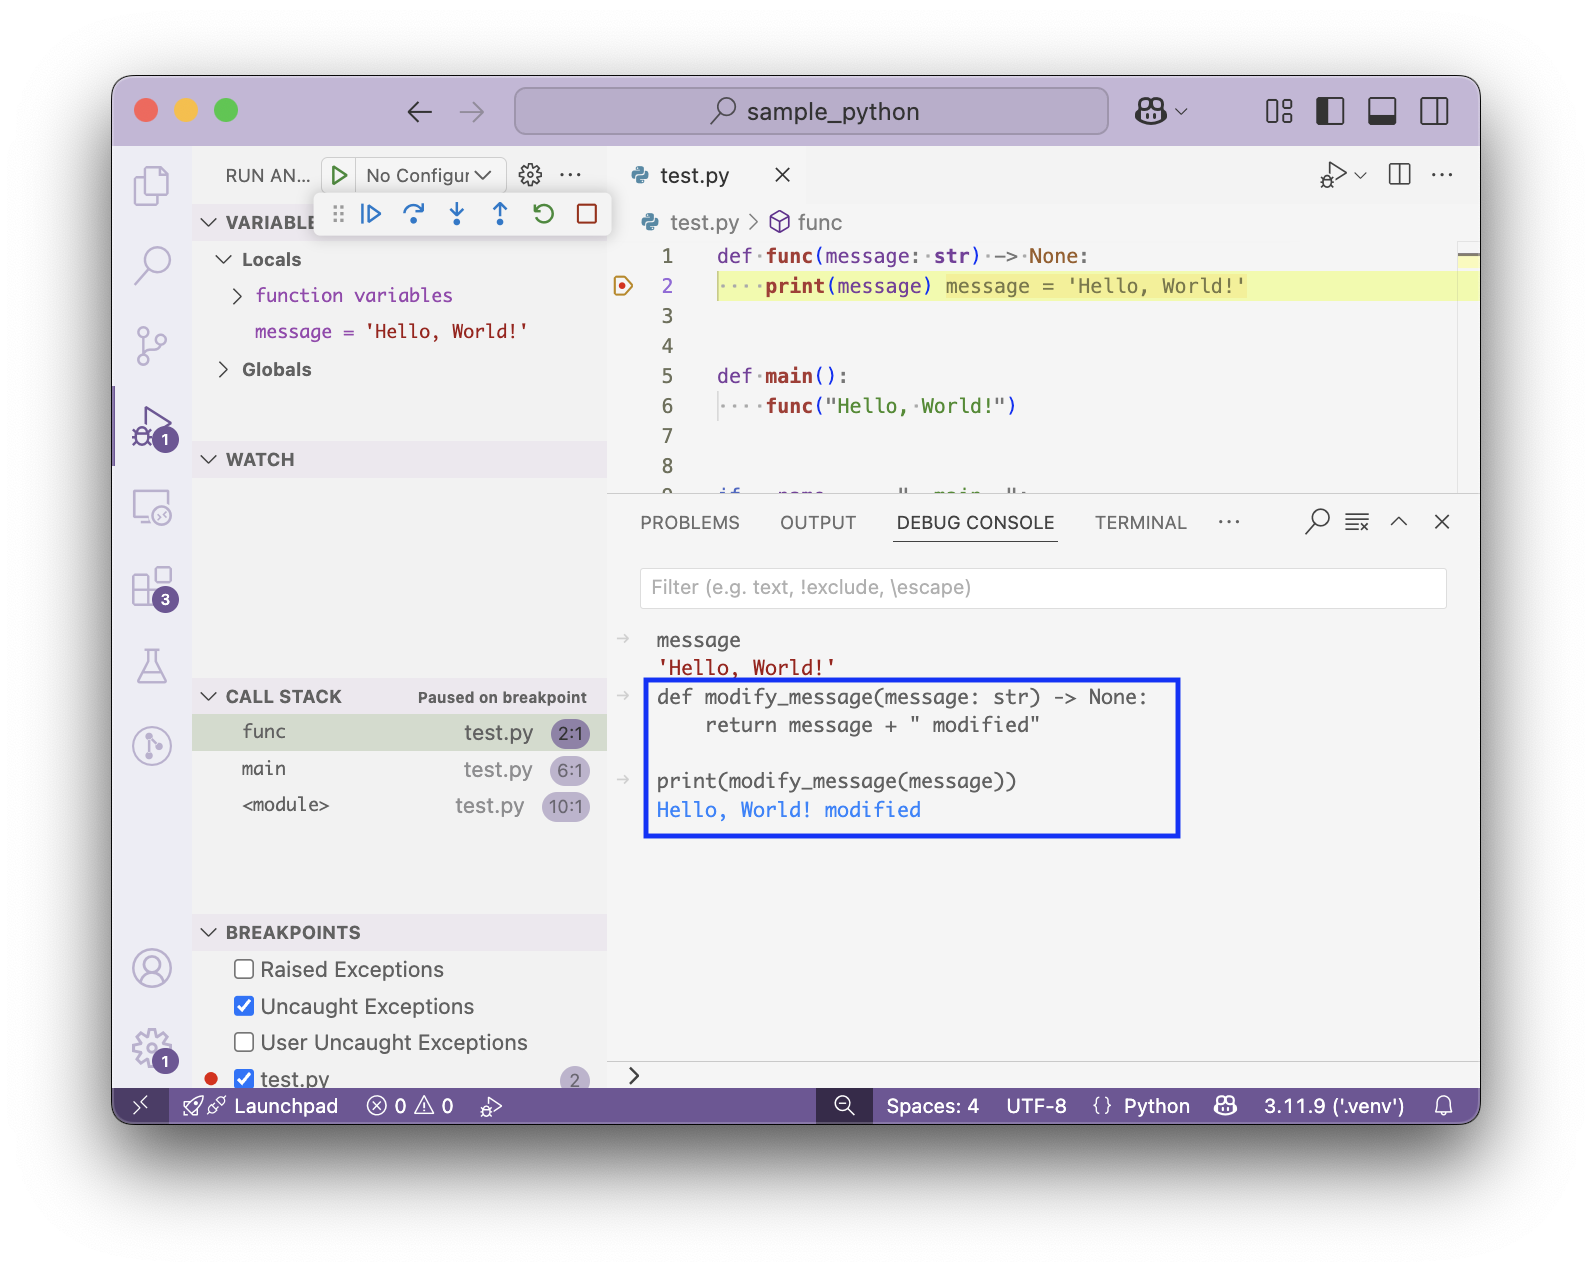
Once a breakpoint is hit, VSCode shows variables and the callstack in the left panel.
The debug console (cmd + shift + y) can be used to inspect variables further and execute logic.
The debug console has autocomplete, and the up arrow iterates through previously executed commands.
You can define new functionality in the debug console, which makes it convenient for quickly iterating on logic given current application state. New dependencies can also be imported in the console.
You can configure breakpoints to stop only on a certain condition, log a message when it’s hit, or stop after a certain hit count. To do so, right click on the breakpoint and select “Edit Breakpoint”.
Configuring debugging via launch.json
Often the processes you want to debug rely on input parameters and/or environment variables.
These can be easily configured in a launch.json file.
The file lives at .vscode/launch.json.
This sample github project has example configurations for:
- Debugging the current file with environment variables and
justmycode = False. This is useful when the script relies on environment variables, or you need to set a breakpoint in a dependency. - Debugging a python module with command-line arguments.
- Debugging tests run via
pytest. - Creating a shortcut to launch multiple debug processes at once.
Here is an annotated sample configuration to start a Celery broker:
{
    "name": "Celery Worker",  # Name in the Run and Debug dropdown
    "type": "debugpy",
    "request": "launch",
    "justMyCode": true,  # Set to `false` if you need to set breakpoints in dependencies
    "module": "celery",  # Use "module" for `python -m <module>`, and "program" for `python <file>`
    "args": [  # Parameters passed to the invocation
        "-A",
        "tasks",
        "worker",
        "--loglevel=info"
    ],
    "preLaunchTask": "Start Redis",  # Task defined in `tasks.json` to run before starting the process
    "postDebugTask": "Stop Redis",  # Task defined in `tasks.json` to run after debugging finishes
    "consoleName": "Celery Worker",  # Name of the terminal that holds the process
    "presentation": {  # Group in the Run and Debug dropdown
        "group": "fastapi-celery",
    },
    "env": {  # Any environment variables needed by the process
        "CELERY_REDIS_PORT": "6389",
    }
}
To launch a configuration:
- Open the Run and Debug side bar (
cmd + shift + d) - Select a configuration from the dropdown (this can be navigated using arrow keys and space/enter)
- Click the “play” button (
F5, or select the button using keyboard navigation).- You should see the process in the “Call Stack” on the side bar
- Note that
F5only seems to work if it is the first debug process you are launching. For additional tasks you have to select the play button via mouse or keyboard.
- To stop debugging: Click the “stop” button on the floating bar, or use
shift + F5 - To restart the process: Click the “restart” button on the floating bar, or use
cmd + shift + F5
These steps are demonstrated in the following video that walks through a debugging workflow:
- Launching a sample web server and celery broker through the VSCode debugger
- Debugging a script that sends requests to the server
- Breakpoints can be set in the endpoint logic, in the celery task, and in the script submitting the requests
- Debugging tests that exercise the server
- Breakpoints can be set in the test, and in the endpoint logic that is being tested
Debugging notebooks in VSCode
Breakpoints can be easily set in notebooks. Simply choose “Debug Cell” to hit them.